#
Parabolically Boosted Staking Distributions
#
Mathematical Model
Our objective is to boost the rewards of a staker at each defined time interval, up to a maximum of double. For this, we define a multiplier that starts at 1 and approaches 2 as the time duration of a stake approaches infinity. The rewards multiplier resets back to 1 when the user un-stakes, thus disincentivizing the user from un-staking.
In order to accomplish the above objective we will define a parabolic curve for the multiplier, we will define a parabolic curve that starts at 1 and approaches 2 as the time staked approaches infinity. We define:
n - a given interval
t - the time duration of an interval in days
m_n - the multiplier at a given interval.
b_n - the boost at a given interval. This is the amount by which the multiplier will increase at each interval
According to our definition:
m_n - should increase at every interval, at a linearly decreasing rate, start at 1 and approach 2 as n approaches infinity.
b_n - should decrease at each interval and approach zero as n approaches infinity.
#
Defining the Function
We define the boost and multiplier as follows:
b_0 = a
b_{n+1} = b_n * r
m_{n+1} = m_n + b_n
Where we define the following constants to be used above:
a - The initial boost acceleration, equivalent to b_n. Describes the steepness the curve at the start.
r - Boost decay resistance. Describes how aggressively the boost decreases over time in order for m_n to never surpass 2.
a + r = 1 - A condition that ensures the multiplier converges to 2 as n approaches infinity. Proof of this can be found here.
The preceding values are configurable, and set to the following values, with the goal of achieving roughly a 1.5 multiple on the rewards after 6 months, with rewards distributed every thirty days.
n = 30 days
a = 0.11
r = 0.89
The resulting rewards graph is as follows:
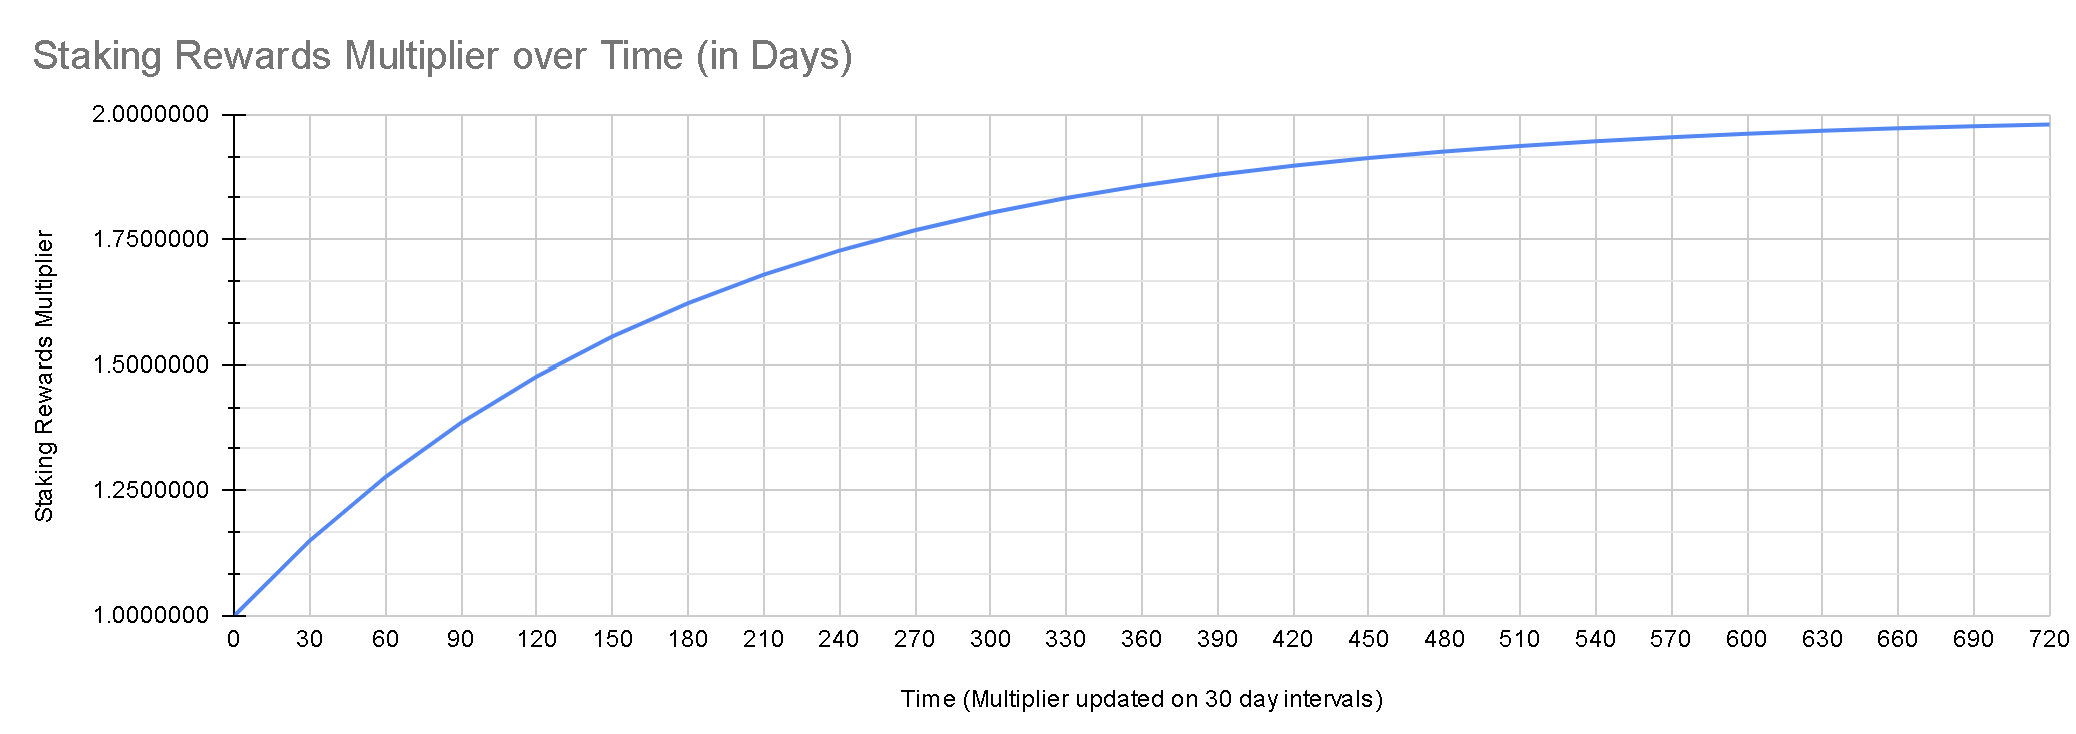
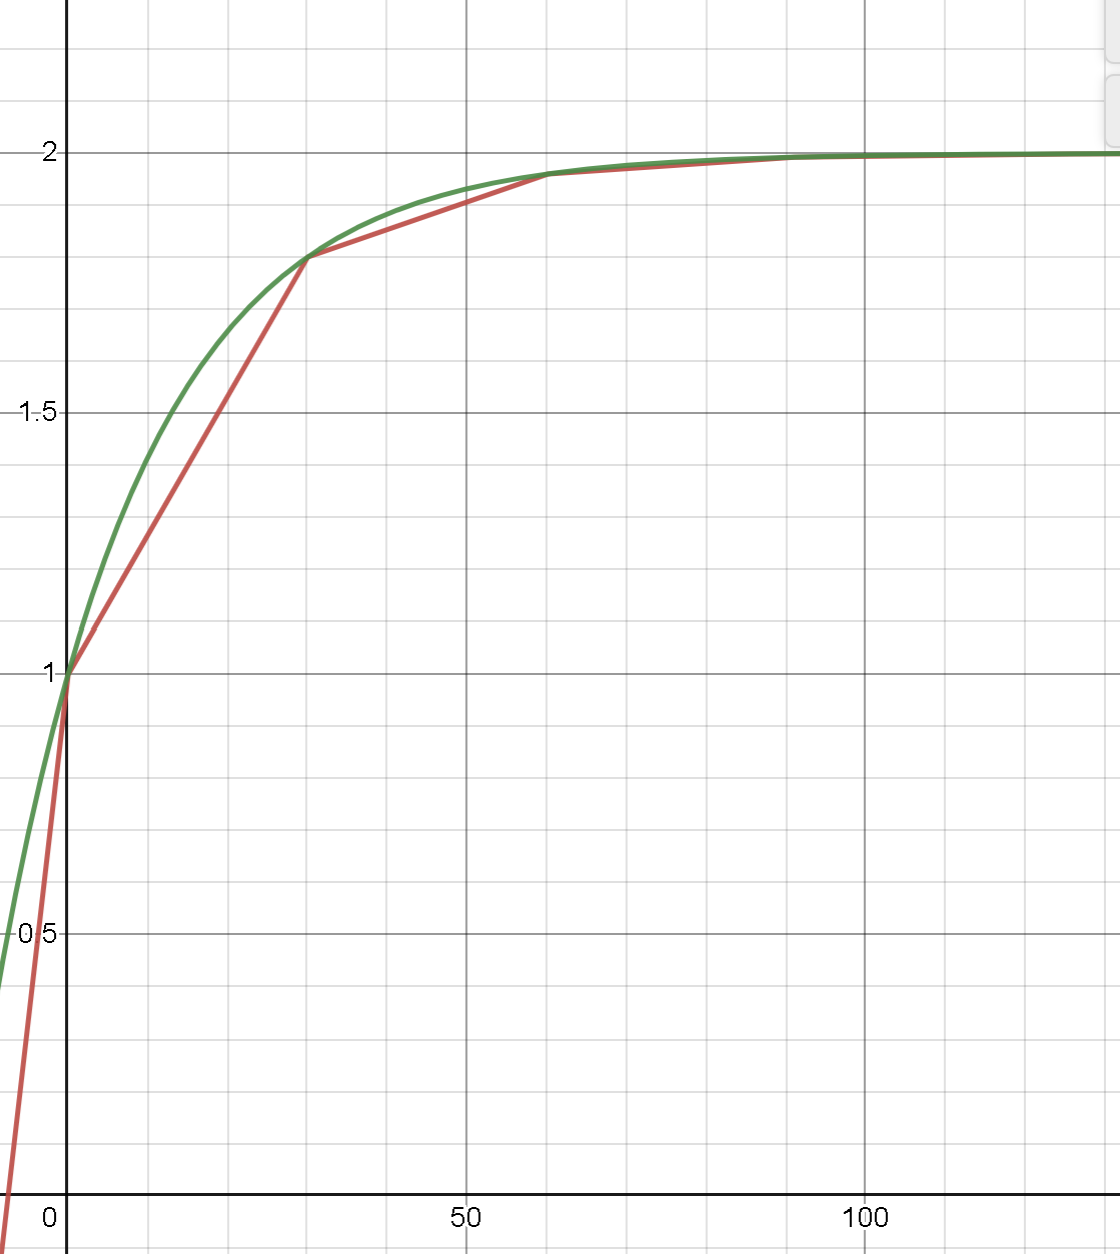
Note, that although at the current scale, this might look like a curve by the naked eye. In reality, it is a series of straight lines between intervals. The purpose of this is to simplify calculations on the smart contracts. More details on the math behind this can be found in subsequent sections.
#
Non-Recursive Representation
The following non-recursive functions define the values of the function m_{n+1} = m_n + b_n. The recursive function only defines m and b on specific intervals. As it does not define what happens in between intervals, there are two variations of the non-recursive version of the function.
The rewards multiplier represented as a smooth curve.
\large{
m(t) = 1 + a \cdot \frac{(1 - r^{(\frac{t}{t_n})})}{(1 - r)}
}
The rewards multiplier represented as a series of linear increments between intervals.
\large{
m(t)=\frac{\left(t_{n}\cdot\left(1+a\frac{1-r^{\lfloor\frac{t}{t_{n}}\rfloor}}{1-r}\right)+\left(a\frac{1-r^{\lfloor\frac{t}{t_{n}}\rfloor+1}}{1-r}-a\frac{1-r^{\lfloor\frac{t}{t_{n}}\rfloor}}{1-r}\right)\cdot\left(t-\lfloor\frac{t}{t_{n}}\rfloor\cdot t_{n}\right)\right)}{t_{n}}
}
For use in our staking mechanism, we will use the equation with linear segments. This makes calculations on the smart contract simpler when token holders stake between intervals.
The derivation of these equations can be found here
An example with exaggerated values set for a and r, makes the difference between the two functions becomes more noticeable.